Whether you’re a hunter, competitive shooter, or just a casual rifle shooter, generating a ballistics chart is one of the most important things you can do to ensure first round hits.

What is a ballistics chart and how do you get one you ask? Have no fear and read on!
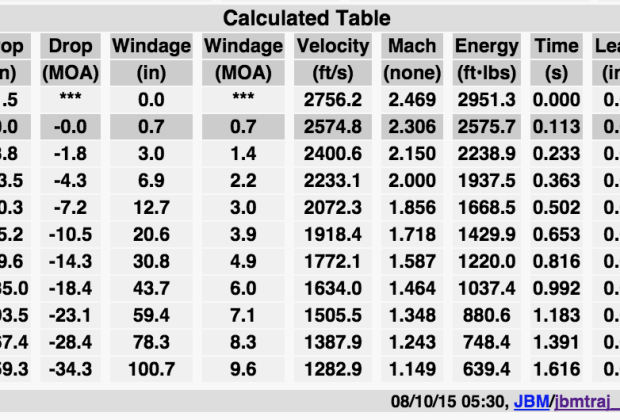
In the simplest term, a ballistics chart is just a table that gives you bullet drop and wind drift at known distances, generally in 100 or 50 yard increments. Once you have this info, you can quickly estimate for your exact range, because the target always seems to 287 yards away…
The first thing you need to generate a ballistics chart is a chronograph. It’s critical that you get the velocity reading out of the exact gun you’ll be using, otherwise it’s just a guess. Most ammunition manufacturers publish velocity data for each load, however, those readings are generally out of a SAAMI Spec test fixture, and not an actual rifle, so the actual reading could be very different. For instance, the SAAMI Spec barrel for 223 Remington is a 24″ 1:12 twist. That may have been accurate with most rifles years ago, before the AR-15 exploded in popularity. Nowadays, you’re most likely to be firing 223 out of a 16″ gas operated gun with a 1:8 or 1:9 twist, so you can expect a much different reading. I’ve personally even seen guns that were in every way identical, have a 30-40 average FPS spread!
The next thing you’ll need is bullet information, such as diameter, weight and Ballistic Coefficient, all of which should be easy to obtain. The only other data you’ll need is what distance you sighted the rifle in, and the height of the centerline of the scope above the centerline of the bore.
Once you have all of your data together, plug it into a ballistic calculator like this one, print it out and keep it either in your bag or make a mini version and tape it to the rifle. There are even apps available for Android and iPhone so you have the ability to make adjustments as needed in the field.


Add comment